
iteration_limit = 89
np.uint8(indexed * 3.6), # RED
np.uint8(int(np.sin(indexed * np.pi) + 1) * 65), # GREEN
np.uint8(indexed * 4) # BLUE
iteration_limit = 89
np.uint8(indexed * 3.6), # RED
np.uint8(int(np.sin(indexed * np.pi) + 1) * 65), # GREEN
np.uint8(indexed * 4) # BLUE
With python3 and the numpy, numba and pillow packages.
Also imagemagick will need to be installed from whatever distro's package repository.
The Mandelbrot Set. The code below will display and / or save as a png image file.
The idea is to open it in a text editor and experiment with operations on the
RGB to get different colouring. Run in the terminal then it is posible to
zoom and offset with -m flag followed by some magnification factor and an -x
flag followed by a complex figure
respectively. Running in an editor will just use the defaults and display the output.
An example command with times ten magnification and offset -1.45 real, 0.1 imaginary:-
python3 fractaling.py -m 10 -x -1.45 0.1
Supply a file name .png after the -o flag to save as an image.
An -n flag will skip the display of output. --help will show help message.
The Mandelbrot Set uses the coordinates of each "pixel" in the complex plane as if it
were mapped out to your screen. X values being real numbers and Y values being imaginary
numbers. The X or real extent being -2.0 to 1.0 and Y or imaginary extent -1.0 to 1.0.
Now, for every pixel denoted by c, in the expression
z = z2 + c, in the
mandlebrot()
function below. The expression iterates on itself until z exceeds the bounds
z real2 + z
imaginary2 >= 4. In which case the number of iterations will be returned unless a
predetermined iteration_limit is reached ( 85 in this case ) and returned. The returned
values are stored in a 2d array result[ row_index, column_index ]. These numbers are used
to build the mandelbrot set image.
There is a good visualization of this process at
www.geogebra.org
Imagine these values being maped to shades of grey : O being dark and 85 being light.
Thats basically how it works.
Now imagine these values being maped to RGB.
Now imagine these values being maped to RGB via your very own custom blend of mathematics.
The possibilities are endless.
#RED #GREEN #BLUE ... read on.
import numpy as np
from PIL import Image
from numba import jit
import argparse


parser = argparse.ArgumentParser(prog="FRACTAL")
parser.add_argument("-n", "--nodisplay", action="store_false",
                    help="do not display output")
parser.add_argument("-m", "--magnification", nargs="?", metavar='MAGNIFICATION',
                    help="required magnification", type=float, default=1.0)
parser.add_argument("-s", "--size", nargs="?", metavar="SIZE",
                    help="Size by y pixels default=700", type=int, default=700)
parser.add_argument("-x", "--xyoffset", action='store', nargs=2, metavar="OFFSET",
                    help="row and column offset", type=float, default=[0.0, 0.0])
parser.add_argument("-o", "--outfile", nargs="?", metavar="SAVE_AS",
                    help="save as <path to filename.whateva>", type=str)

args = parser.parse_args()
if args.magnification < 1.0:
    parser.error("magnification must have a minimum value of 1")
if abs(args.xyoffset[1]) > 1 or args.xyoffset[0] < -2 or args.xyoffset[0] > 1:
    parser.error("xyoffset must range between -2 to 1 and -1 to 1 respectively")


@jit
def mandelbrot(re, im, iter_limit):
    c = complex(re, im)
    z = complex(0.0, 0.0)
    for i in range(iter_limit):
        z = z**2 + c
        if (z.real**2) + (z.imag**2) >= 4:
            return i
    return iter_limit


try:
    iteration_limit = 85
    columns = args.size
    rows = int(columns * 1.5)
    magnification = args.magnification
    row_offset = args.xyoffset[0]
    col_offset = args.xyoffset[1]

    row_extent = (np.array([-2.0, 1.0]) + row_offset * magnification) * 1 / magnification
    column_extent = (np.array([1.0, -1.0]) + col_offset * magnification) * 1 / magnification
    result = np.zeros([rows, columns])
    for row_index, re in enumerate(np.linspace(row_extent[0], row_extent[1], rows)):
        for column_index, im in enumerate(np.linspace(column_extent[0], column_extent[1], columns)):
            result[row_index, column_index] = mandelbrot(re, im, iteration_limit)

    result = result.T
    print(f"image size: {result.shape[1]}, {result.shape[0]}")
    image_array = np.zeros((columns, rows, 3), dtype=np.uint8)
    for real in range(rows):
        for imaginary in range(columns):
            indexed = result[imaginary, real]
            image_array[imaginary, real] = (np.uint8((np.sin((indexed) * np.pi / 85) * 255)), # RED
                                            np.uint8(80 + (indexed * 2)),                     # GREEN
                                            np.uint8(170 - (indexed * 2))                     # BLUE
                                            )

    new_image = Image.fromarray(image_array, "RGB")
    if args.outfile:
        new_image.save(args.outfile)
        print("image saved")
    if args.nodisplay:
        new_image.show()

except KeyboardInterrupt:
    parser.exit("\n Interupt by user")
except Exception as e:
    parser.exit(f"{type(e).__name__}: {str(e)}")
The returned iterations resut[ ] from z = z**2 + c are used for all three
colors: Red, green and blue. A different operation is performed on the indexed result[ ] value
for each colour. You can do whatever operation you like as long as the answer is between
0 and 255. Although going higher than 255 is the same as 0, so it can be useful.
( This includes increasing the iteration_limit a tiny little bit )
For example:-
indexed = result[imaginary, real]
image_array[imaginary, real] = (np.uint8(170 - (indexed * 2)),                           # RED
                                np.uint8((np.sin((indexed) * np.pi / 85) * 255)),        # GREEN
                                np.uint8(80 + (indexed * 2.1))                           # BLUE >255
                                )
As you can see np.uint8(whatever operation to indexed)
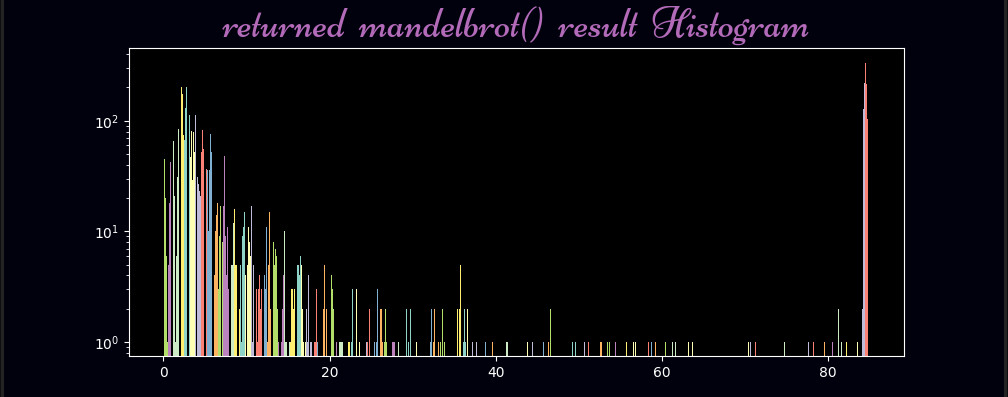
Any old random crap will do. You will be surprised. Or a histogram of the returned values can give guidance.
Image size can be changed by assigning new values to rows and column variables.
for example: rows = 1920 and columns = 1280
A copy of the code is also on
codeberg.org
If you do not Know numpy just stick np.
in front of all your trigonomic funcions and pi or whatever, you will be fine. It will either work
or not work.
After some experimenting (below left) with sine and cosine. And another (below right) with iteration_limit = 86. Later the center is erased and replaced with some layers in GIMP photo editor.

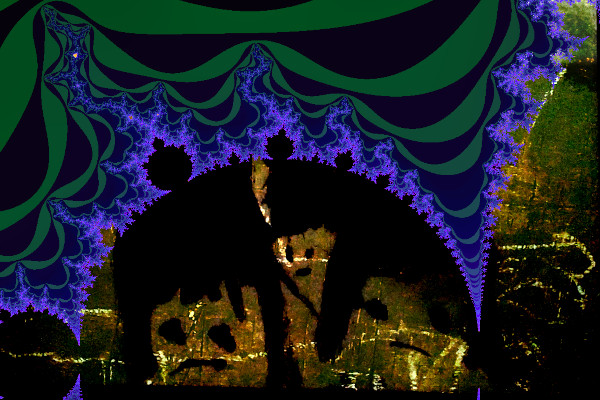
image_array[imaginary, real] = (np.uint8((np.cos(indexed * np.pi * 3 /85) + 1) * 60),   # RED
                                np.uint8((np.sin(indexed * np.pi * 4 /85) + 1) * 30),   # GREEN
                                np.uint8(indexed * 0.7)                                 # BLUE
                                )
# Any old crap.
A few months ago or more, I had recorded 3 words, with a microphone into a numpy array, grabbed the envelope for each word with
the
envelope_grabber.py code from Experimentations Then resampled it
with
scipy.signal.resample to match the iteration limit of the mandlebrot(re, im, iteration_limit)
function (85 iterations in this case). Then the values in the resampled sound array are scaled to range between 0 and 255. Then its
np.uint8(sound_array[int(indexed)]).
Interesting. I even tried it with musical instruments too. Trimming
them in Audacity first. But i soon got bored.
import numpy as np
import scipy.signal as sig
import sounddevice as sd
import matplotlib.pyplot as plt
import time


class ThyEnveloper():
    """
    Get the envelope of a sound.
    data - 1d numpy array.
    window_size - int, optional n samples. default=700.
    invert - boolean, optional invert envelope. default=False.
    """
    def __init__(self, data, window_size=700, invert=False):
        self.data = data
        self.window_size = window_size
        self.invert = invert

    def get_envelope(self):
        "Returns the envelope"
        self.data_size = np.size(self.data)
        self.data = np.abs(self.data)
        self.result = np.zeros(self.data_size)
        self.iterations = int(self.data_size // self.window_size)
        self.extra = self.data_size % self.window_size

        for i in range(self.iterations):
            self.ave = np.max(self.data[i * self.window_size:i * self.window_size + self.window_size])
            self.slice = np.linspace(self.result[i * self.window_size-1] if i > 0 else np.max(
                                     self.data[i:self.window_size]), self.ave, self.window_size)
            self.result[i * self.window_size:i * self.window_size + self.window_size] = self.slice

        self.slice = np.linspace(self.result[-self.extra - 1],
                                 np.max(self.data[-self.extra:]), self.extra)
        if self.invert:
            self.result = 1 - self.result
        if self.extra == 0:
            return self.result
        else:
            self.result[-self.extra:] = self.slice
            return self.result


sample_rate = 44100
duration = 1.0          # Recording duration

# Count down to start of recording
print("3")
time.sleep(0.5)
print("2")
time.sleep(0.5)
print("1")
time.sleep(0.5)
print("GO")

# Record
sound = sd.rec(int(duration * sample_rate), samplerate=sample_rate, channels=1)
sd.wait()

# Normalize
sound = sound / np.max(np.abs(sound))

# Play back recording
sd.play(sound)
sd.wait()

# Grab envelope
envelope_obj = ThyEnveloper(sound)
envelope = envelope_obj.get_envelope()

# Resample
new_array_size = 86
sound_envelope_resampled = sig.resample(envelope, new_array_size)
sound_envelope_resampled = sound_envelope_resampled * 255
print(np.max(sound_envelope_resampled))
print(np.min(sound_envelope_resampled))

plt.figure()
plt.plot(sound_envelope_resampled)
plt.show()
Then something like This
image_array[imaginary, real] = (np.uint8(sound_envelope_resampled[int(indexed)]),         #RED
                                np.uint8(sound_envelope_resampled[int(indexed)] * 0.5),   #GREEN
                                np.uint8(255- (sound_envelope_resampled[int(indexed)]))   #BLUE
                                )
And then there is the Julia Set. It is basically the same code as the mandelbrot
only z gets passed the complex coordinates and c is a constant. A whatever
complex number you like constant. But it is probably best to start with some numbers from halfway
down the WikipediA page.
The rows and columns will need equal numbers and the extent is from -2 to 2 on both axis.
------+------
There is no reason why you can't mess with the z = z 2 + c expression either.